

Guides
Nielsen, Comscore and Sensor Tower: why audience counts diverge
Audience measurement units decide the number. Nielsen, Comscore, ad reach and Sensor Tower count people, accounts, apps and visits, so fix the unit first.
What to take away
- US audience reporting leans on four instrumentsNielsen and Comscore panels, platform ad reach, Similarweb clickstream and Sensor Tower telemetry.
- Each counts a different unit, so people, accounts, installed apps and visits cannot share one chart.
- Vendor ranges put one large US platform near 75 million to 85 million monthly users in 2024, against about 95 million to 100 million in 2022.
- Fix the unit, name the vendor and mark the break before two periods go on one line.
The unit of analysis decides the number
Measurement disputes usually begin with the wrong question. The useful one is what gets counted, and by whom.
Nielsen and Comscore recruit panels of people and project them to a national population.
Definitions carry more weight than dashboards, and the the honest guide to marketing attribution shows how credit moves when the unit shifts.
Where the same audience splits
| Metric and unit | Instrument | What it counts | Main weakness |
|---|---|---|---|
| Monthly unique people | Nielsen, Comscore panels | A person in a recruited sample | Panel turnover |
| Daily active accounts | Platform ad reach | An account served an ad | Dormant logins |
| App opens and sessions | Sensor Tower | A device with the app installed | No desktop or browser |
| Monthly web visits | Similarweb | Panel and clickstream data | Modeled, not counted |
Similarweb blends panel and clickstream data into visit estimates. They are modeled, not counted.
Sensor Tower reads device telemetry: installs, opens and sessions. It is strongest on mobile-heavy groups.
Platform ad reach counts accounts an ad could hit in a window. A dormant login still appears.
Vendor ranges put US monthly uniques near 75 million to 85 million in 2024, against about 95 million to 100 million in 2022.
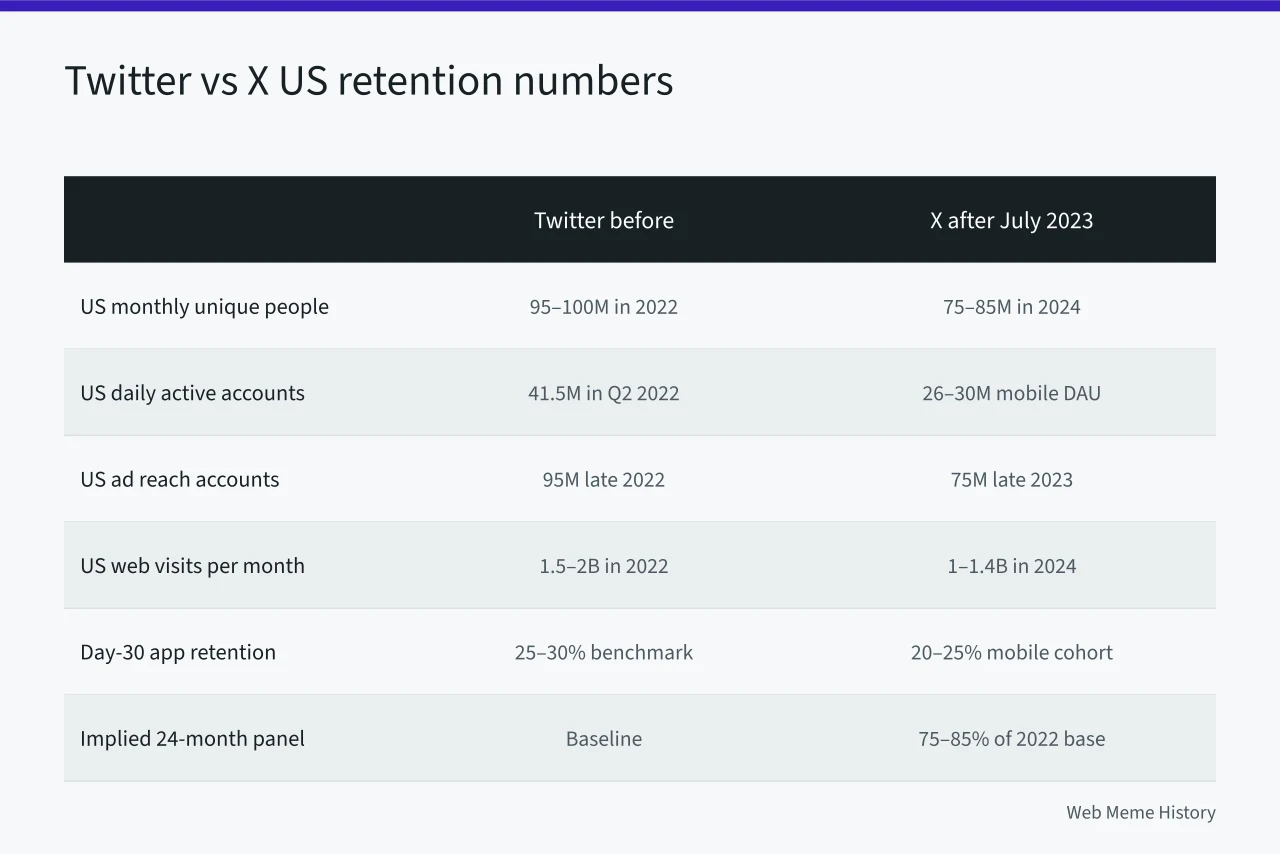
A panel series can run across a platform rebrand without a break, while ad reach cannot. That gap is a definition problem, which is why reading campaign measurement with a sceptical eye starts by naming it.
Matching the instrument to the decision
Four steps keep a comparison honest.
- Write the unit firstperson, account, installed app or visit.
- Pick the instrument that produces that unit, not the fastest dashboard.
- Apply that unit on both sides of a break, or split the line and label it.
- Report a tracking change month on its own instead of smoothing it into a trend.
Panel data suits reach plans, demographic cuts and filings a regulator may read. Device telemetry suits product questions about opens, sessions and returning users.
Ad reach suits fast market sizing, where buyer and seller are the same party.
A vendor that publishes a unit and a window is easier to defend than one that publishes a headline.
None of that eases the harder problem, which is that a plan needs one number. Marketing KPIs for people who want the details sets out which figures survive a review.
Example: two reports, one month, opposite directions
A brand sees panel reach down 8 percent and app sessions up 12 percent for the same month. Both reports are correct.
The panel row counts people. The telemetry row counts devices, and a reinstall counts again. Neither sees the logged-out desktop reader.
Attribution tooling hits the same wall. Multi-touch attribution assigns credit to touchpoints, and a touchpoint is not a person.
Aggregate models sidestep person-level counting by working on totals, which is where marketing mix modeling fits.
A retention figure with no stated unit and no stated window is an anecdote with a decimal point.
Both teams can report accurately and still describe different populations. Ask which unit a number carries before asking whether it moved.
Build a model on unit-checked inputs, not on a vendor headline. Building a marketing mix model that survives scrutiny walks through the sequence.
Where these numbers feed a model
Media plans, incrementality tests and budget reviews consume the same inputs, and the unit discipline travels with them.
An incrementality test needs a comparable control group, plus a fixed unit and a stated window. Aggregate and user-level methods answer different questions, and the overview of web analytics shows how far the tool categories overlap.
Keep the method matched to the decision, then hold the unit steady for the life of the plan.
A plan that mixes panel people with ad reach accounts will show a move no audience made. Give budget reviews the number with its unit attached.
Two vendors disagreeing on the same month is normal. Note the rare case where they agree on the same unit.
A brief that settles the unit, the window and the vendor saves rework later. Common marketing analytics strategy questions with honest answers attached covers what to settle before you brief an analyst.